Time-resolved Bayesian Evidence Display
Continuous Bayesian inference on time series
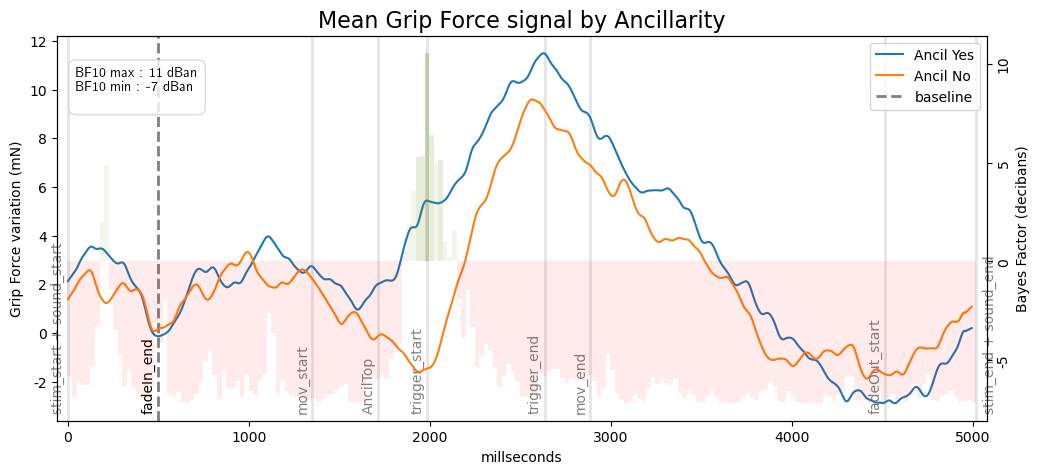
The Time-resolved Bayesian Evidence Display (TBED) is a method for continuous Bayesian inference on time series data. Rather than testing a single aggregated value, it applies a Bayesian paired t-test at each time point between two conditions, using a weakly informative Cauchy prior (\(r = 0.707\); Rouder et al. (2009)). The resulting Bayes Factors are expressed in decibans (\(10 \times \log_{10}(\text{BF}_{10})\)), providing an additive and interpretable evidential trace over time.
Reading the TBED
Deciban values follow the thresholds proposed by Jeffreys (1961):
| Decibans | Evidence |
|---|---|
| > 20 | Decisive |
| 15 – 20 | Very strong |
| 10 – 15 | Strong |
| 5 – 10 | Substantial |
| -5 – 5 | Anecdotal |
| < -5 | Evidence for H₀ |
| < -20 | Decisive evidence for H₀ |
Because the deciban scale is continuous and additive, sub-threshold variations also carry interpretive value. A sustained shift of 6 dBan — such as a progression from −7 to −1 dBan — represents the same magnitude of evidential change as a movement from 0 to +6 dBan, and may reflect genuine but modest signal when it unfolds over consecutive time points against a stable evidential background.
Why pointwise Bayesian inference?
Standard approaches to time series comparison require correction for multiple comparisons — inflating thresholds and reducing sensitivity to temporally concentrated effects. The Bayesian framework sidesteps this issue: Bayes Factors quantify evidence at each time point without inflating Type I error, making the TBED particularly suited to continuous signals where effects may be brief and localized.
Unlike frequentist cluster tests, which define clusters based on arbitrary significance thresholds, the TBED identifies Bayesian evidence clusters — continuous windows where evidence consistently exceeds a given deciban level. These clusters can serve as data-driven temporal localizers for confirmatory analyses (see Validation).
Implementation
The TBED is implemented in Python using the Pingouin package (v0.5.5; Vallat (2018)) for Bayesian t-tests, and Matplotlib for visualization. Bayes Factors are binned into 50 ms windows for display. Analysis scripts are available on OSF.
Further reading
- Validation — Convergent analyses on the Ancil vs. Direct comparison
- How to read a TBED — Detailed guide to interpretation (coming soon)
- Code & Data — OSF repository